Removing transmission line effects using FIR filters
Time:2023-08-13
Views:754
The serial data output speed of the Network Serial Deserializer (SERDES) has reached as high as 28Gbps and continues to develop. At such high data rates, even short PCB wiring can act as a transmission line, thereby reducing signal integrity through attenuation and scattering. It is difficult to monitor the output signal of the SERDES transmitter on the solder ball of the chip. Usually, the signal is led to the SMA or SMP connector and monitored using an oscilloscope. However, the signal characteristics may change due to the transmission line between the IC and the connector. Therefore, the real challenge is to monitor signal performance at the SERDES pin, which can be achieved by removing transmission line effects. This design example introduces a method for removing transmission lines.


Assuming H (s) is the impulse response of the wiring, and if X (s) is the input signal, from a mathematical perspective:
Y (s)=H (s) × X (s)
X (s)=Y (s) × H-1 (s)
H-1 (s) can be implemented as a finite impulse response (FIR) filter and the filtering coefficients can be determined using MATLAB (refer to the document at the end of the article).
The H (s) of the wiring can be measured using a network analyzer, and the measurement object is Sdd21. Firstly, it is necessary to determine the coefficient of the FIR filter (hf (t)), whose frequency response (Hf (s)) is close to the reciprocal of Sdd21 measured above, that is, Hf (s)=H-1 (s). The method of calculating filter coefficients is to first calculate the frequency response from a specific coefficient, and then calculate the amplitude error between H (s) and Hf (s). Finally, use optimization algorithms to change the coefficients until the sum variance is minimized.
Reference FIR_ Filter_ Design. m, nc is the coefficient value in the FIR filter, and drain is the data rate of input serial data in Gbps. Select the appropriate fs so that fs/rate is an integer. This will define the coefficient value represented by 1 bit. Ncbit provides the time difference between adjacent coefficients. Assuming N is the number of points in the frequency response Hf (s), numfpts=N/2 is the number of frequency points within the Nyquist range. The Nyquist frequency of the filter transfer function is fs/2. Then, define the frequency range from finmin to finmax, so that the amplitude error within this range can be calculated.
The corresponding filter frequency point for Nyquist is:
Hz1=(k × Fs)/(2 × Numfpts), k=0 to numpts-1
The interpolation operation is completed by calculating the Sdd21 amplitude at the Hz1 frequency point. Initialize the filtering coefficient to a certain value. Use the freqz MATLAB function to calculate the frequency response amplitude of the filter, and then determine the error between the interpolated Sdd21 amplitude data. The use of MATLAB fminbnd functions can minimize the sum variance to the greatest extent. There are many implementation methods for the minimization algorithm, and the code provided in this article is only one of them.
experimental result
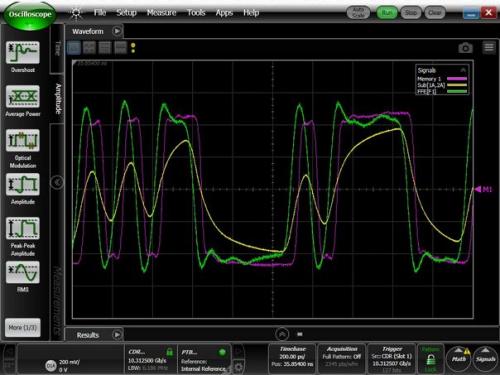
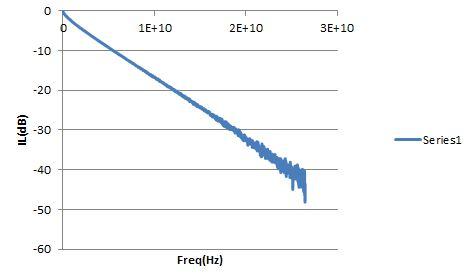
To demonstrate the effectiveness of the FIR filter, a Keysight 86100D sampling oscilloscope and a Tektronix BERTScope were used to generate a pattern with a rate of 10.3125Gbps. The output of BERTScope is connected to DS0, and the waveform is stored in the oscilloscope memory, as shown in Figure 1 (magenta). Then connect the BERTScope output to the transmission line on the PCB; The change in SDD21 (dB) of the channel is shown in Figure 2. Connect the output of the channel to DS0 (yellow line). The attenuation and scattering caused by the channel significantly degrade the waveform. In the mathematical function options of the oscilloscope, there is a linear equalizer module whose input is the filtering coefficient. Insert the linear equalizer module into the signal path and input the filtering coefficients. The output of this module is represented by a green line. The FIR filter eliminates the ISI effect of the channel, and the restored waveform is quite perfect.

Figure 1: BerScope PRBS7 output (magenta); The signal at the PCB wiring output end (yellow); FIR filter output (green).

Figure 2: Sdd21 for PCB wiring
The FIR coefficient obtained from the MATLAB code is:
0.766, -0.115, -0.097, -0.119, -0.090, -0.099, -0.083, -0.033, 0.028, 0.015, 0.042, 0.013, 0.024, -0.008, 0.002, -0.019, 0.000, -0.025, 0.005, -0.014, 0.011, -0.007, 0.021, -0.002, 0.014, -0.009, 0.009, -0.018, 0.003, -0.022
Summary of this article
By eliminating the attenuation caused by PCB wiring, the filter greatly improves signal integrity. This process can be carried out using oscilloscopes, offline or hardware implementation methods.
There are some differences between BertScope output and filter output, which are caused by:
●There are some spikes in the first user interface (UI). This is caused by the high values of filtering coefficients a2, a3, and a4. Most high-frequency amplification is achieved through these coefficients, which can cause spikes. Corrections can be made by modifying the algorithm.
●Low pass filtering (LPF) function should be used to limit the frequency band of H1 (s). This will form a band-limited filter and minimize errors throughout the entire transfer function. This also has the potential to reduce the peak in the first UI. The filter in this article is frequency limited by defining fmin and fmax, which may introduce certain errors.
●When determining the filter coefficients, the phase signal is not included, which can also introduce certain errors.
By implementing these correction measures in the design algorithm, the calculation of filtering coefficients can be improved.
|
Disclaimer: This article is transferred from other platforms and does not represent the views and positions of this site. If there is any infringement or objection, please contact us to delete it. thank you! |


