Classification and application analysis of oscilloscopes
Time:2024-03-29
Views:201
An oscilloscope is an instrument used to display waveforms, displaying the variation of signal voltage over time. Therefore, oscilloscopes can be used to measure the frequency and period of signals, the rising/falling edge of signals, signal overshoot, signal noise, temporal relationships between signals, and so on.
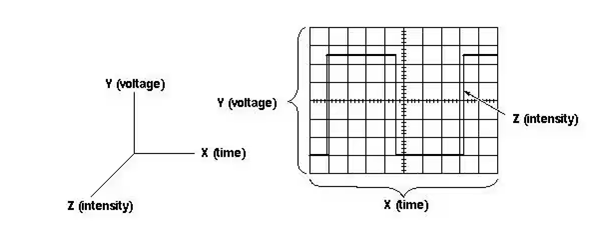
On the oscilloscope display screen, the horizontal axis (X) represents time, and the vertical axis (Y) represents voltage. (Note that if the oscilloscope has the function of measuring current, the vertical axis also represents current.) Also, there is the less attention paid - brightness (Z). In TEK‘s DPO oscilloscope, brightness also represents the probability of occurrence (it is represented by a 16 degree grayscale)


On the oscilloscope display screen, the horizontal axis (X) represents time, and the vertical axis (Y) represents voltage. (Note that if the oscilloscope has the function of measuring current, the vertical axis also represents current.) Also, there is the less attention paid - brightness (Z). In TEK‘s DPO oscilloscope, brightness also represents the probability of occurrence (it is represented by a 16 degree grayscale)

Oscilloscopes are divided into multimeter, digital oscilloscope, analog oscilloscope, virtual oscilloscope, arbitrary waveform oscilloscope, handheld oscilloscope, digital fluorescence oscilloscope, and data acquisition oscilloscope. There are generally two types of oscilloscopes: analog oscilloscopes and digital oscilloscopes.
In many cases, both analog and digital oscilloscopes can be used for testing, but we usually use analog oscilloscopes to test signals that require real-time display and rapid changes, or very complex signals. And using a digital oscilloscope to display signals with relatively strong periodicity. In addition, since it is a digital signal, the built-in CPU or specialized digital signal processor of the digital oscilloscope can process and analyze the signal, and can save waveforms, which is very convenient for analysis and processing.
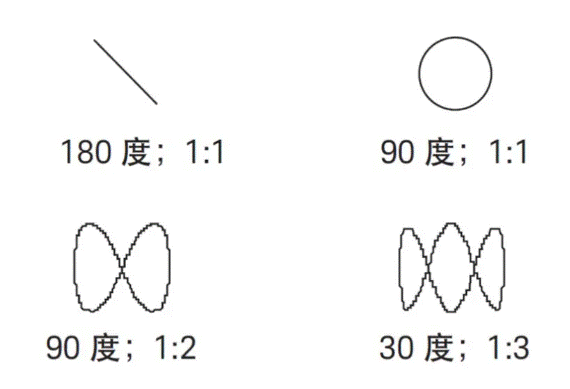
The function of an oscilloscope is not just to draw a voltage time graph. The oscilloscope provides multiple inputs (also known as channels), and each channel can work independently. Therefore, you can connect channel 1 to one device and channel 2 to another device. Subsequently, the oscilloscope can draw a comparison chart between the voltages measured in channel 1 and channel 2, respectively. This mode is called the XY mode of the oscilloscope and is suitable for drawing I-V or Lissajous plots.
According to the shape of the Lissajous plot, the phase difference and frequency ratio between two signals can be determined. The figure shows the Lissajous plot and its representative phase difference/frequency ratio.

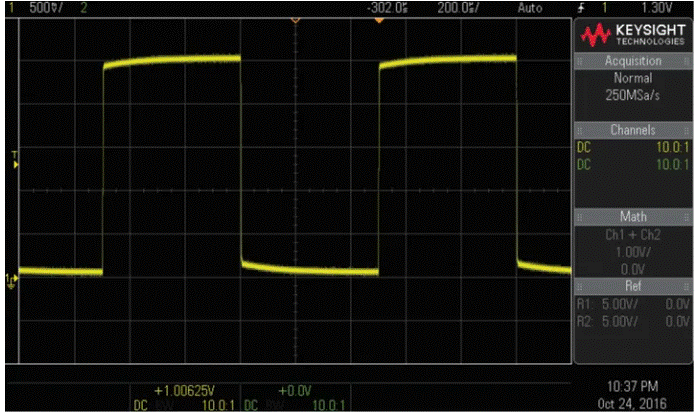
The voltage time graph of the square wave displayed on the oscilloscope

The experimental principle of using an oscilloscope
An oscilloscope is an instrument used to display and measure the waveform of electrical signals. Through an oscilloscope, signal changes in a circuit can be observed and analyzed. The following is the experimental principle of using an oscilloscope:
1. Connect the circuit: First, connect the output signal of the circuit to be tested to the input terminal of the oscilloscope through a signal wire. Usually, an oscilloscope has two channels and can display both signal waveforms simultaneously. It can also trigger a single signal waveform using an external trigger function.
2. Set oscilloscope parameters: Use various knobs and buttons on the oscilloscope panel to set various parameters of the oscilloscope, including triggering method (edge trigger, pulse trigger, etc.), triggering level, horizontal scanning rate, vertical sensitivity, etc.
3. Adjust waveform display: Adjust the vertical sensitivity and horizontal scanning rate of the oscilloscope based on the amplitude and frequency of the signal waveform, so that the signal waveform can be clearly displayed and fully presented on the oscilloscope screen.
4. Trigger signal: Set appropriate trigger method and trigger level to ensure that the oscilloscope can stably display the waveform of the test signal and capture the specific signal that needs to be observed.
5. Waveform analysis: By observing the waveform displayed on the oscilloscope screen, analyze the signal changes and characteristics in the circuit, such as frequency, amplitude, waveform shape, etc., in order to carry out troubleshooting, signal analysis, and circuit design work.
The oscilloscope collects the signal waveform of the circuit to be tested and displays it on the screen, helping engineers and technicians observe and analyze the circuit. By adjusting the parameters and triggering method of the oscilloscope, clear signal waveform images can be obtained, thereby better understanding the signal changes and characteristics in the circuit.
|
Disclaimer: This article is transferred from other platforms and does not represent the views and positions of this site. If there is any infringement or objection, please contact us to delete it. thank you! |


